

Marketing Mix Model
Measure what your marketing actually drove, channel by channel, from your historical spend and outcome data.
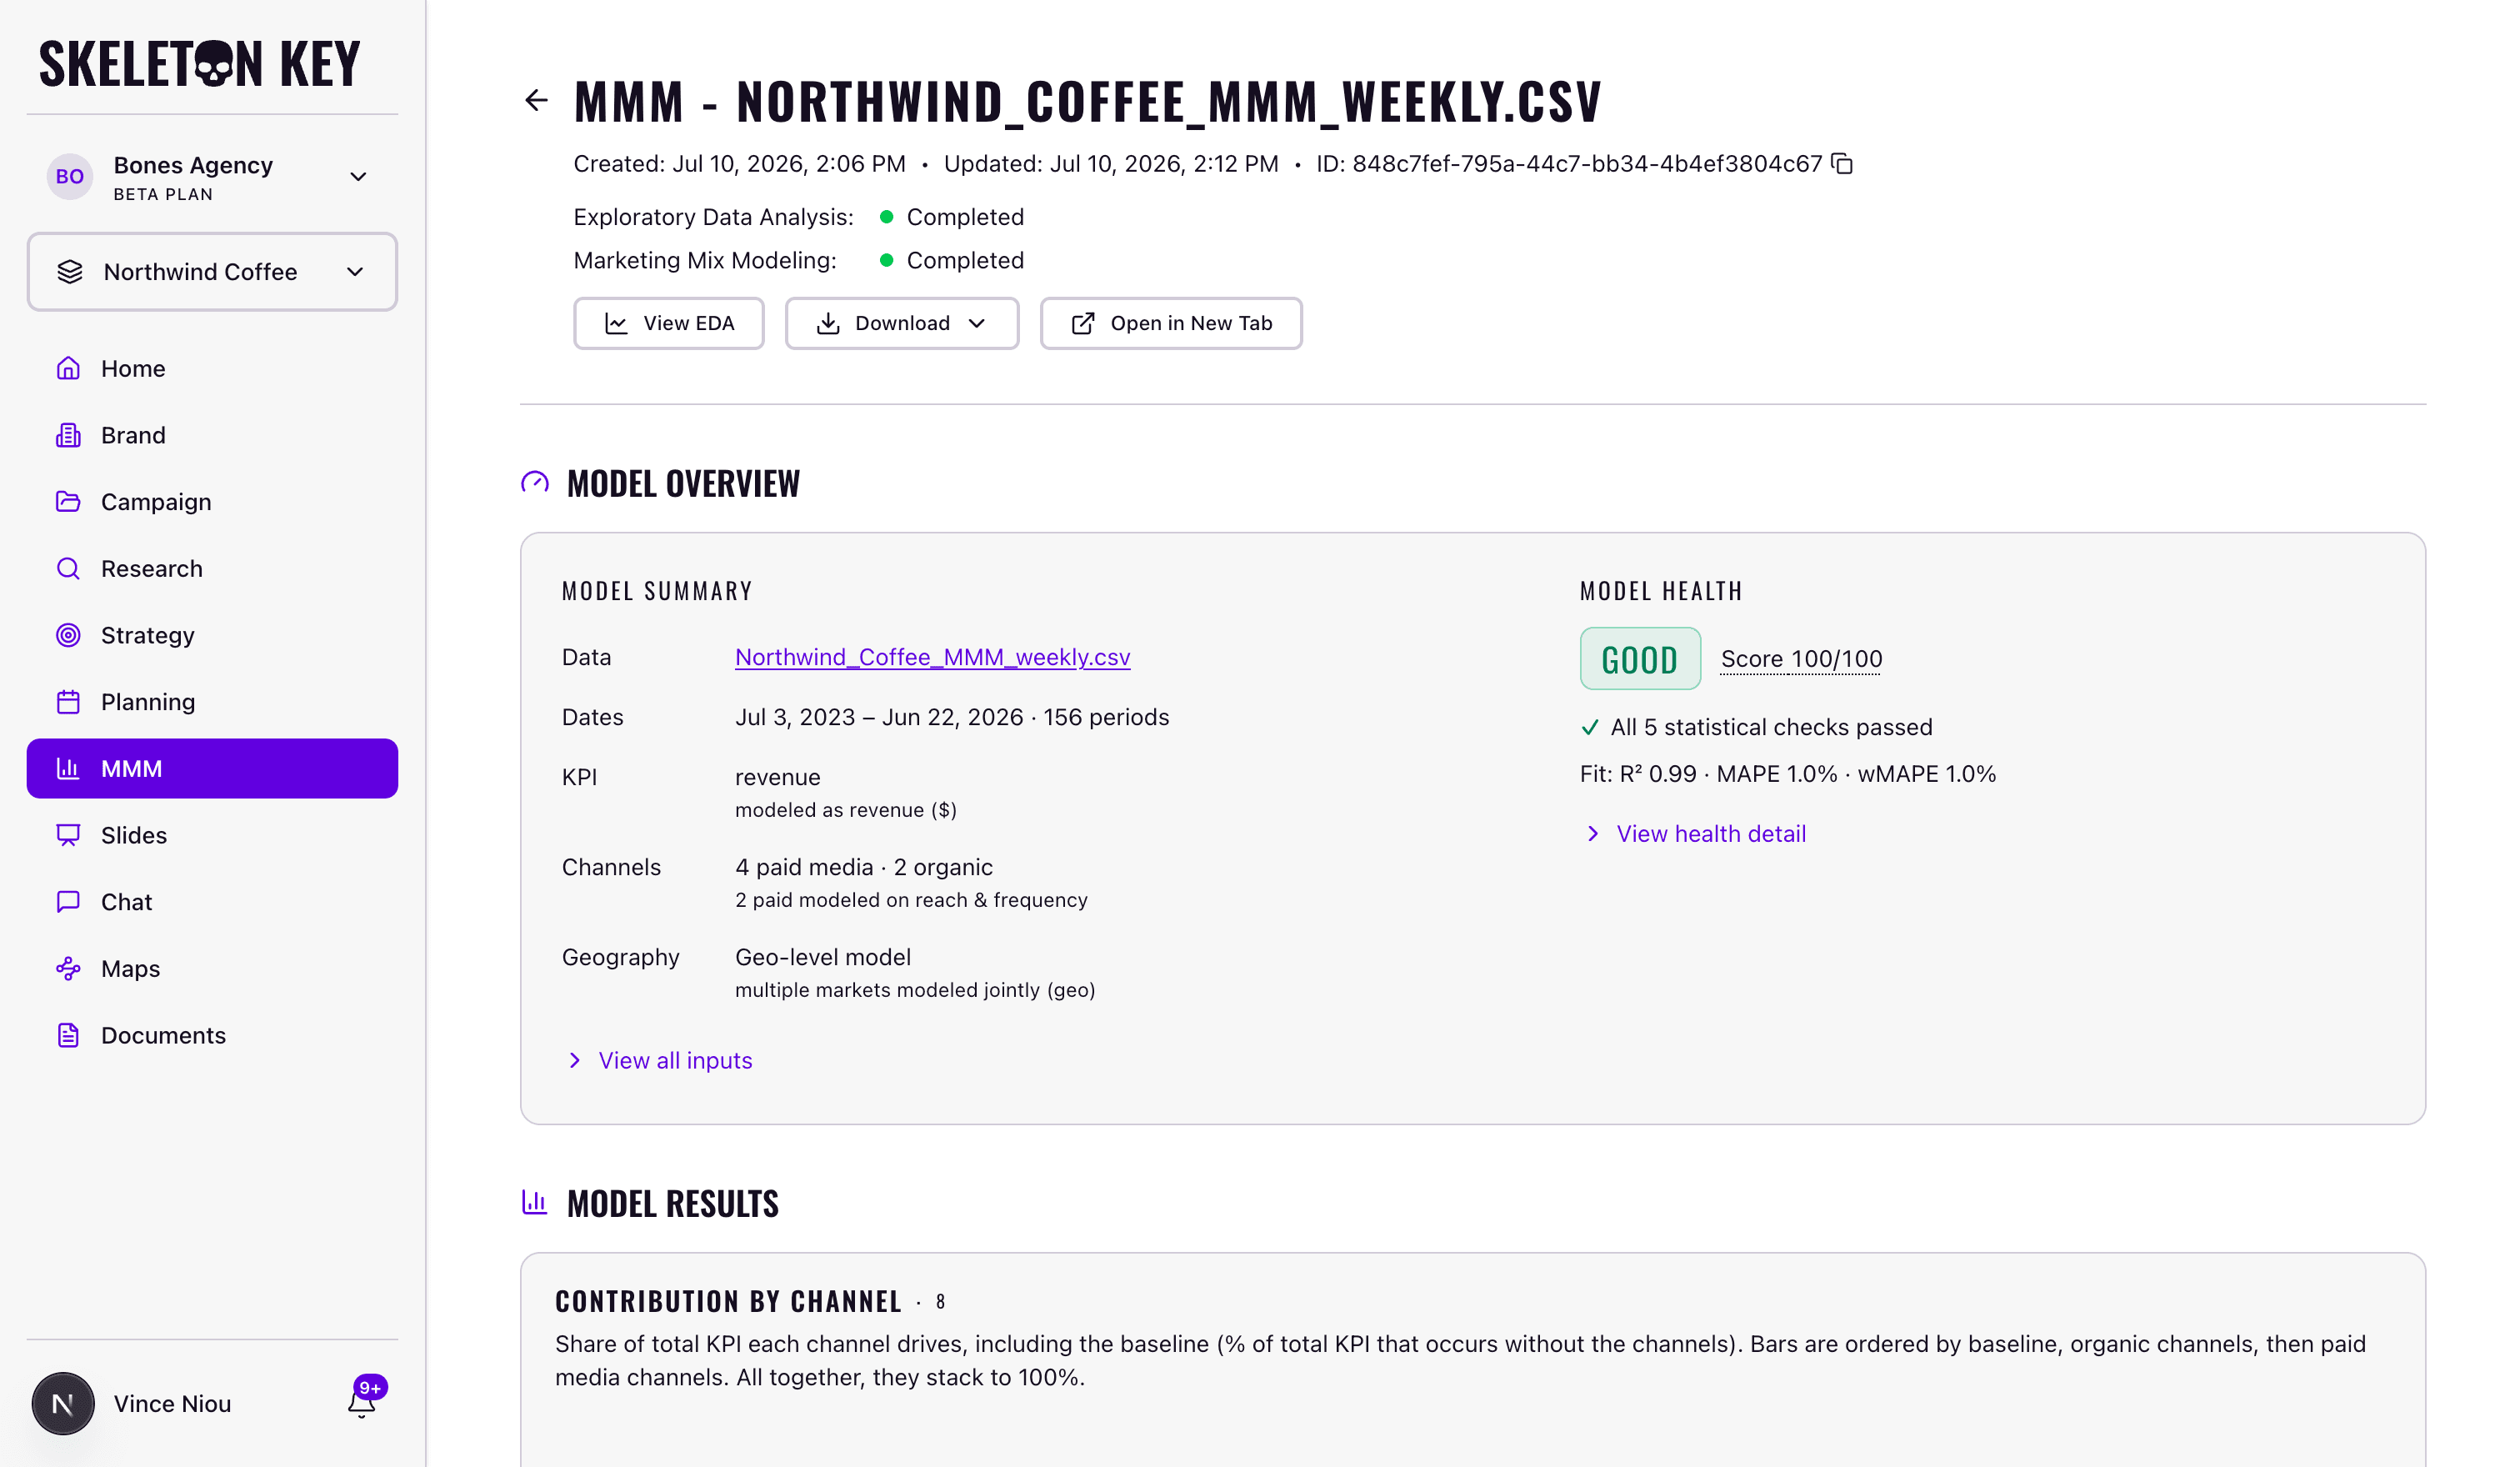
A Marketing Mix Model measures how much each of your channels actually contributed to sales, signups, or whatever outcome you care about. It reads your historical spend and results, separates what your marketing drove from what would have happened anyway, and gives you a return figure for each channel.
This is a different question from the one your attribution dashboard answers. Attribution assigns credit along individual user journeys (which click came last, which touchpoint gets the conversion). A Marketing Mix Model never looks at individuals. It works from aggregate, period-by-period data and estimates the incremental lift each channel caused, including the channels that attribution can't see well, like TV, out-of-home, or upper-funnel video. It also accounts for things outside your marketing (seasonality, price, promotions) so they don't get miscredited to a channel.
The Skeleton Key MMM currently runs on Meridian, Google's open-source modeling engine, but is built to support other open-source MMM models over time.
What Skeleton Key adds
Running Meridian yourself means a Python and GPU stack, hand-coded data inputs, choosing the right statistical assumptions, and reading raw diagnostics. Skeleton Key handles all of that, so a media planner or marketing manager can run an MMM without writing code. On top of the raw model, it adds:
- Guided setup. You bring one CSV. Skeleton Key recognizes and maps your columns, checks your file against the model's data rules and blocks any run that is guaranteed to fail, and provisions the compute for you.
- Plain-English insight. Every chart comes with an explanation, a glossary translates the statistics, the data check flags problems before you run, and multi-region runs get per-region performance views. You can download both the data check and the results as a PDF of the report you see, a Markdown file of the numbers, or Meridian's own technical report.
- A link to your strategy. The results are saved as a brand document; attach it to a Strategy run and the Goals Strategist and Media Strategist ground your goals and media mix in what the model measured, not assumptions.
What it produces
When a run finishes, you get:
- Return by channel. What each channel returned on its spend, shown as a range rather than a single number, because the model is honest about its own uncertainty.
- Diminishing returns curves. How the next dollar in each channel performs as you spend more, and where a channel starts to saturate.
- What drove your results. A breakdown of your outcome into the baseline (what you'd have earned with no marketing) and the share each channel contributed.
- Optimal frequency. For reach and frequency channels, the average weekly frequency where the channel's return on spend peaks. This only appears when you map reach/frequency channels.
- A model-health verdict. A plain read on whether the model settled and fit your data well enough to trust the numbers. A healthy model also carries a quality score out of 100; a failed model shows no score, because a number computed from a model you shouldn't trust would only mislead.
Paid and organic are measured differently
Paid channels are the ones you scale with money: budget up, budget down, add a channel, cut one. For those the model gives you the full toolkit, including return on spend and the diminishing-returns curves.
Organic drivers (email sends, organic social, newsletter reach) carry no spend, so there is no return to compute and no spend curve to draw. The model still measures their contribution and shows it in the breakdown, which keeps their credit from being wrongly handed to your paid channels. They are also harder to steer: you control how many emails you send, but not how far a post travels.
When to use it
A Marketing Mix Model answers strategic budget questions ("which channels are worth more money," "where are we hitting diminishing returns") rather than tactical ones ("did this creative beat that one"). For tactical questions, an incrementality test is the better tool. A Marketing Mix Model is an aide to judgment, not a replacement for it.
One caveat to hold from the start: treat the numbers as directional. They tell you the relative story (this channel is working harder than that one, this one is saturating) more reliably than they pin down an exact return to the second decimal. The reading results page explains how to read the model-health verdict so you know how much weight the numbers can carry.
This is the same class of model that measurement consultancies build, run in-house on your own data instead of outsourced. It is in beta.
Do you have the data for it?
Three things decide whether an MMM can work for you. Check them before you assemble a file.
- Enough history. The setup flags anything under a year of weekly data as an error. Google's guidance for Meridian is closer to three years for a national model, or two when your data is split by region, because every region is another set of evidence. Under that, expect directional reads rather than confident ones.
- Varying channel spend. The model learns by watching your results change when your spend changes. A channel that spent the same amount every week gives it nothing to learn from, and the data check flags it. Flighting, seasonal pushes, tests, and budget shifts all count as useful variation.
- Meaningful KPI contribution. The model splits your KPI into a baseline (what happens without marketing) and the share your channels drove. If most of your KPI comes from organic demand rather than the channels you pay for, the model may find little or weak signal from your paid channels, and the returns it reports will be wide and uncertain.
How a run works
Prepare data
One CSV: date, outcome, spend per channel
Data check
Meridian flags adequacy and data issues
Run model
The fit runs, roughly 8 to 25 minutes
Read results
Health verdict, ROI, curves, contribution
Two pages walk through the halves of that flow that need the most care. Prepare your data covers getting your data in and mapping your columns. Read your results covers reading the run once it finishes.
Where to find it
Click MMM in the left sidebar to open the MMM Center, where your past runs live. Start a new one with New MMM run, or take the Quick tour to walk through a run end to end on example results before you bring your own data.
Setup saves as you go. Pick a file and leave at any point; the model stays in the MMM Center as a card marked Draft, and Resume setup on the card takes you back to where you stopped. To discard one, hover over the card and use the trash icon. Deleting a draft removes the saved setup, but the CSV you uploaded stays in Documents.
Limits and considerations
- It needs the data described above. Short histories or channels with little spend variation produce weaker, less trustworthy runs.
- The model runs on sensible defaults. The model assumptions (the ROI prior, and how much the baseline can bend) and the advanced settings (sampling draws, chains, and burn-in) are there for experienced users, and changing them without a reason, the ROI prior especially, can bias the results.
- It works best alongside incrementality experiments, not instead of them. If you've run a lift or incrementality test, you can set the model's ROI prior from that result, which calibrates the model toward a return you measured directly. The two together beat either alone.
Last updated: 2026-07-12