

Prepare your data
What your CSV needs, how to map each column to a role, and how to read the data check before you run a model.
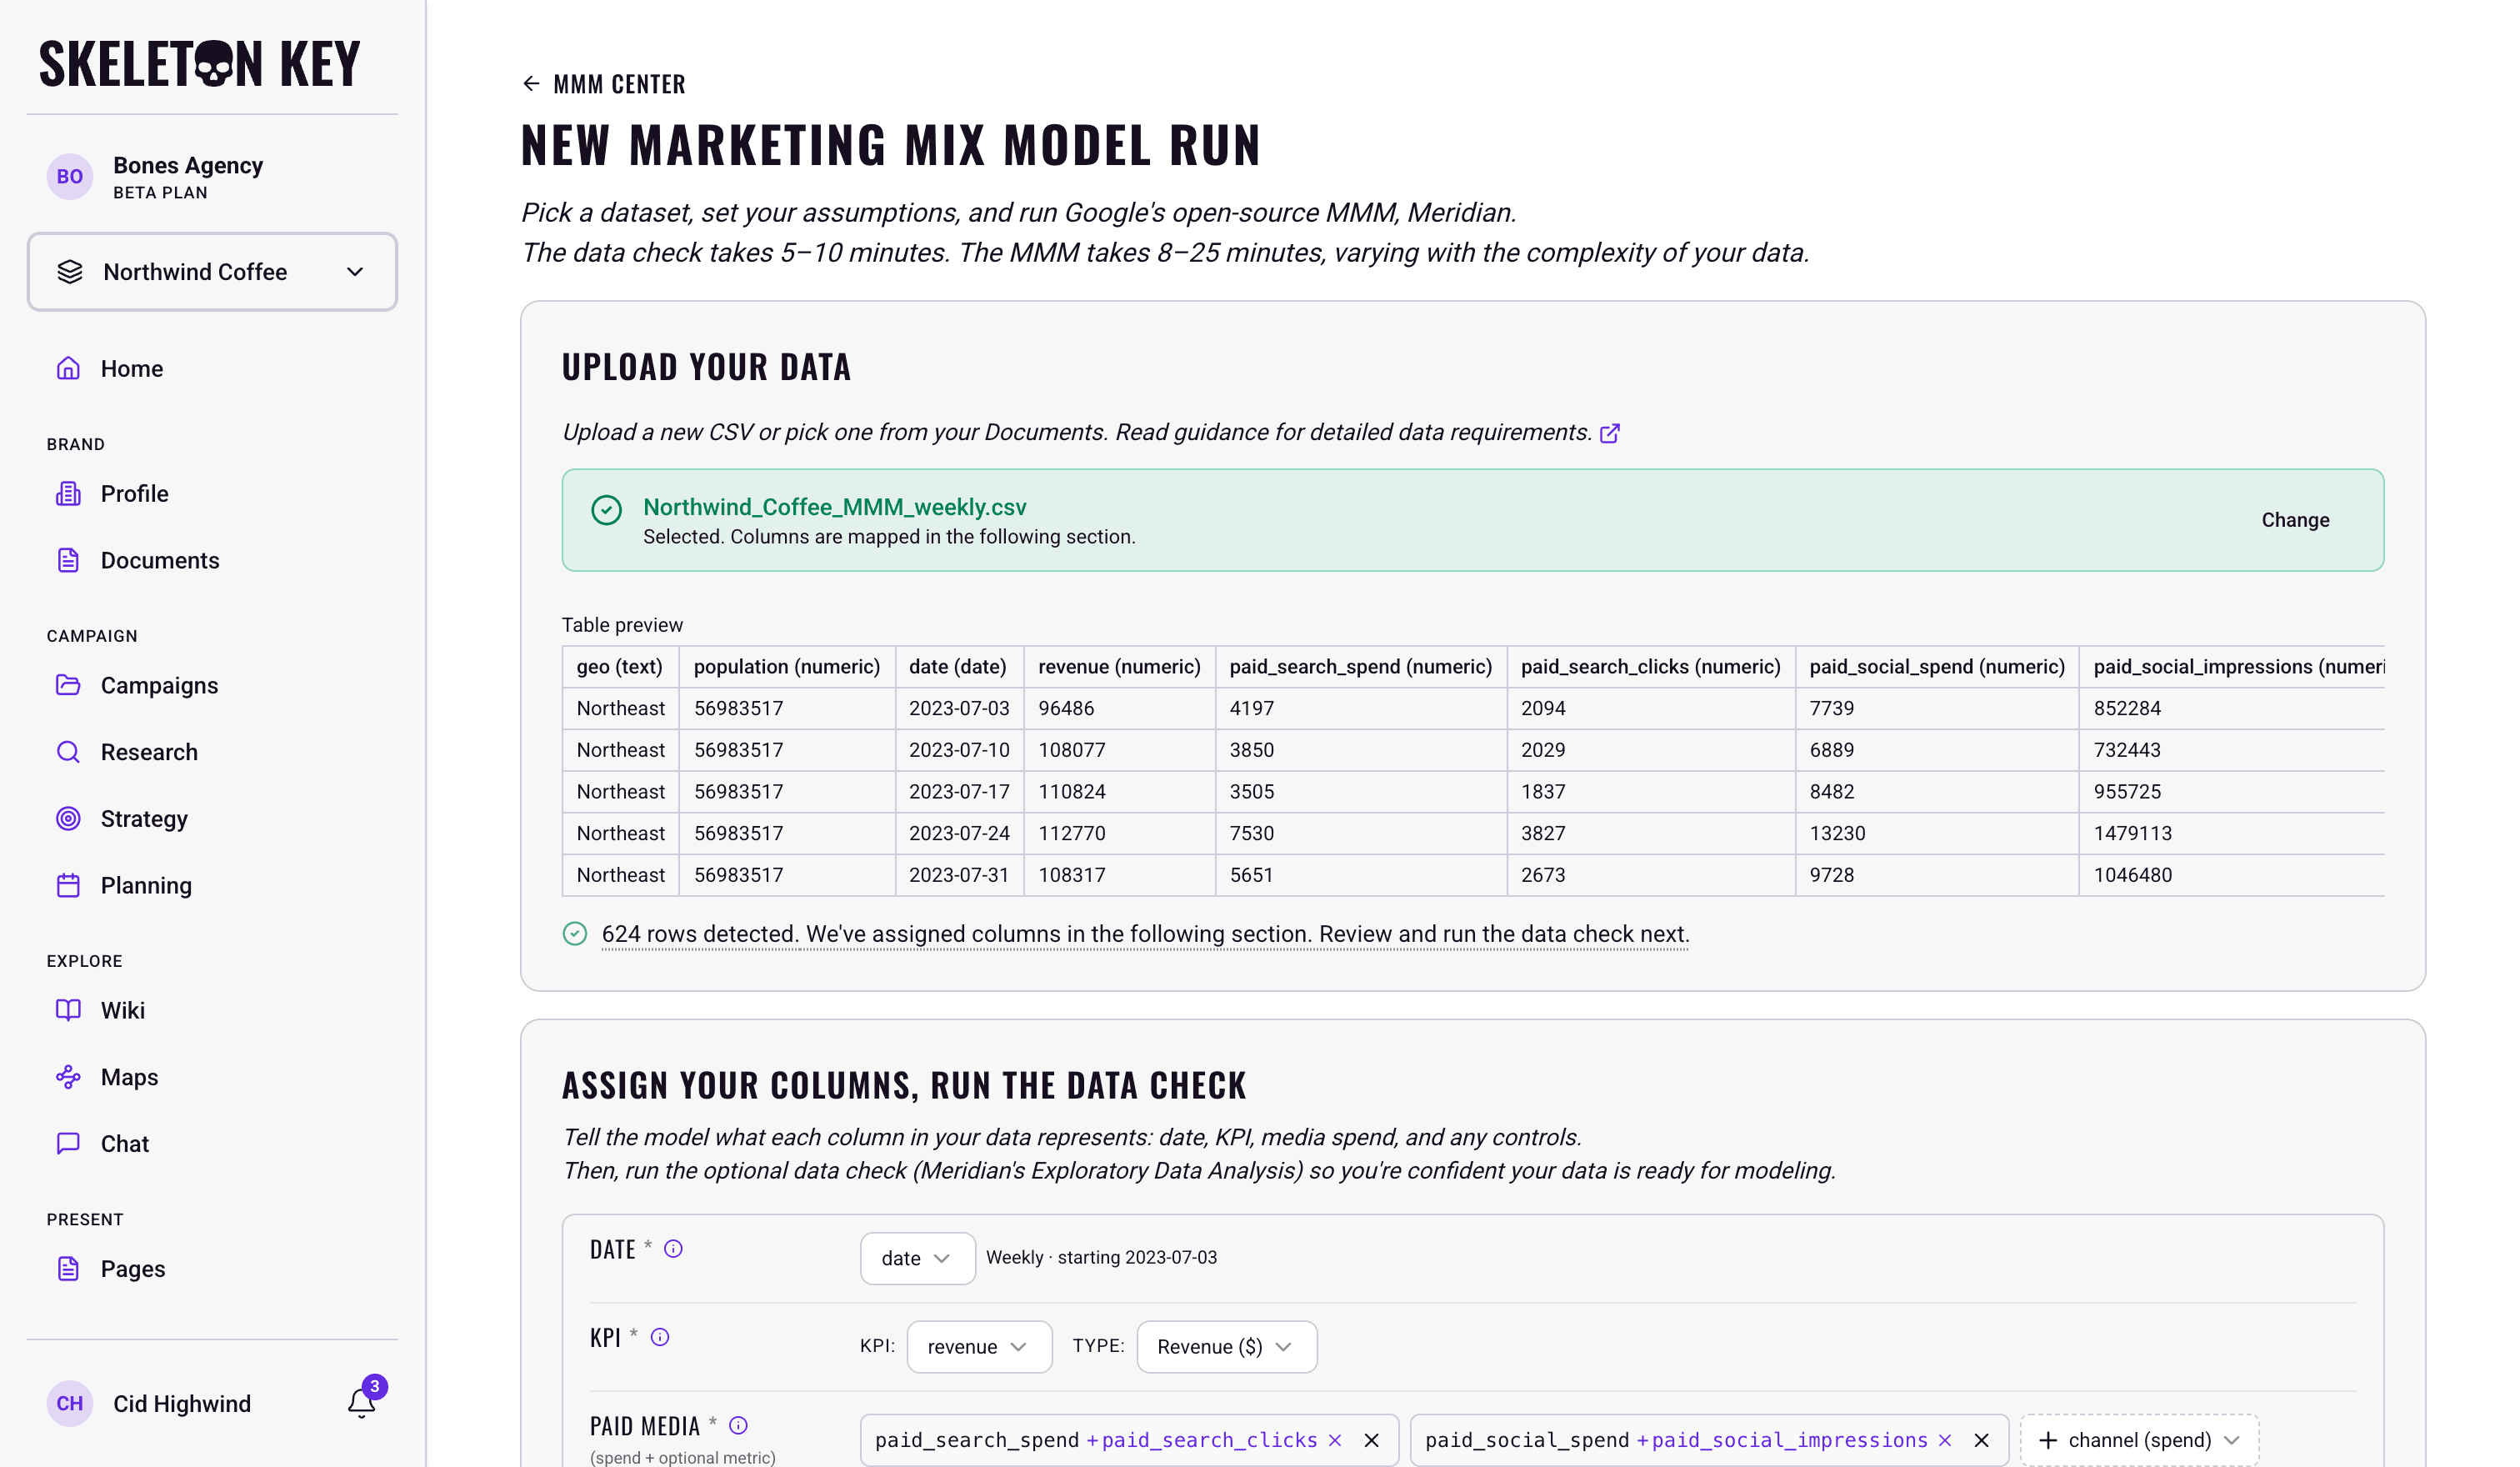
Most of the work in a Marketing Mix Model happens before the model runs. The model is only as good as the data you feed it, and this is the step where runs most often go wrong. This page covers what your file needs, how to map your columns, and how to read the data check.
Prerequisite
A single CSV (up to 10MB) with a date column, an outcome column (your KPI), and at least one column of channel spend, covering a regular cadence over enough history. The National and Multi-geo templates linked on the new-run page follow exactly this shape if you want a file to copy.
Setup does not have to happen in one sitting. Once you pick a file, everything you set on the page saves automatically as a draft, and the MMM Center holds it until you come back to resume or delete it.
What your data needs
You assemble one CSV yourself. Skeleton Key does not pull from your ad platforms automatically, so you export from Google, Meta, your analytics, and anywhere else, and combine them into a single table.
The shape is one row per time period, with your variables as columns:
- One date column, at a regular cadence. Weekly is the cadence Meridian is built around. Keep the gap between rows constant: every row a week, or every row a day, not a mix.
- One outcome column (your KPI). This is what the model explains, like revenue, orders, or signups.
- At least one channel of spend. One column per channel, holding what you spent that period.
- Enough history. As a rule of thumb the model wants roughly 15 periods of data for every thing it has to estimate, so more channels and more controls need more history. The setup flags anything under a year of weekly data as an error; Google's guidance for Meridian is closer to three years for a national model, or two when your data is split by region. The data check (below) tells you where you stand before you commit to a run.
Channel names become the labels you see in the results, so keep them readable. The channel name is the spend column without its _spend ending: paid_search_spend shows up as paid_search, linear_tv_spend as linear_tv.
Rules the file must follow
These hard rules break the MMM model every time. Our setup page is designed to prevent runs on broken data, and guide you on what to fix.
- Dates in
YYYY-MM-DDformat (2024-01-29, not01/29/2024). The engine reads dates in exactly this shape and rejects anything else, including formats that look fine in a spreadsheet. - No gaps, no mixed cadence. Every period present, all with the same spacing. A missing week fails the run, and so does a file that switches from weekly to daily rows partway through.
- Each date appears once. In a multi-region file, once per region and date.
- Every region covers the same dates. A region missing even one period that the others have fails the run.
- No blank cells in mapped columns. Fill gaps with a real value, or 0 where 0 is the truth (a channel that spent nothing that week).
- No negative values in spend, your KPI, or exposure metrics like impressions and reach. If refunds push a week's revenue negative, reassign it correctly before you upload.
- Complete reach and frequency sets. An R&F channel needs all three columns (reach, frequency, and spend); an organic R&F channel needs both reach and frequency. A partial set fails.
- Every channel has its own name. Because the channel name drops the
_spendending (and_reachfor organic reach and frequency),tvandtv_spendwould both become the channeltv, and the run fails. If a baretvcolumn holds TV's impressions, clicks or GRPs, attach it totv_spendas its metric, or rename ittv_impressions(or_clicks,_grps). Controls are exempt. - Population on every row. In a multi-region file, the population column carries the region's population as a positive number, repeated identically on every row of that region.
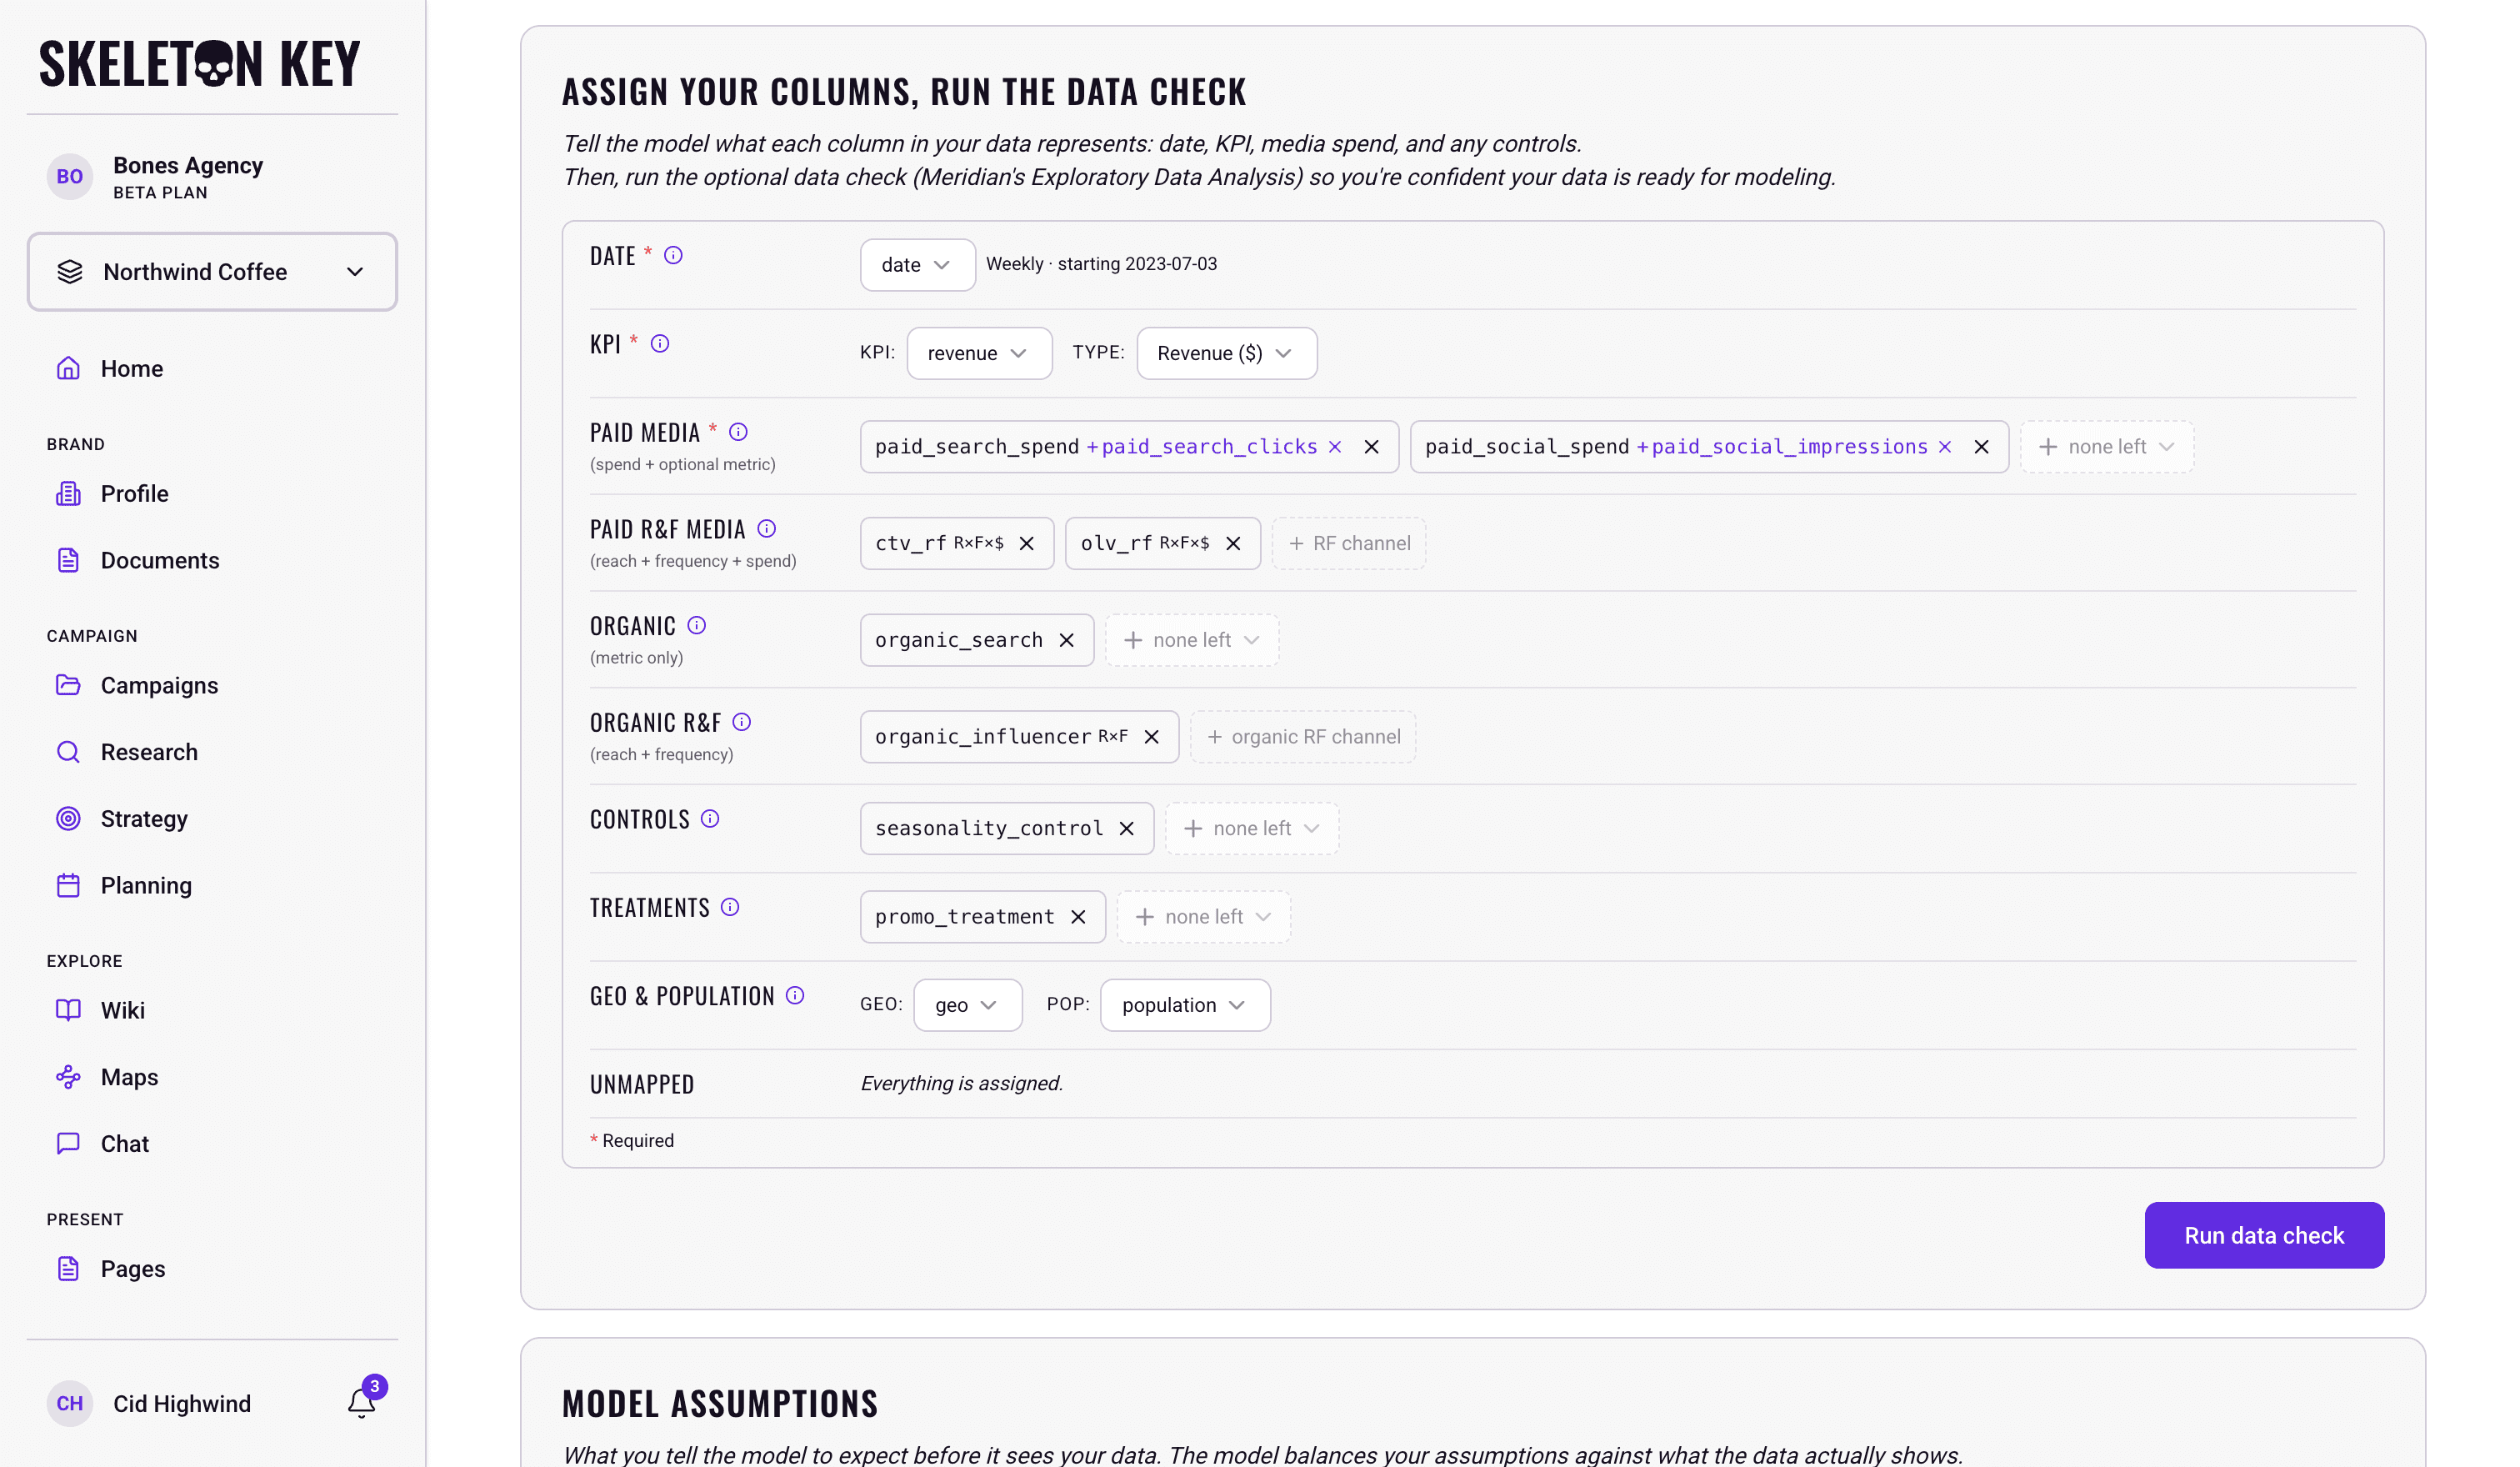
After you upload, each column is assigned a role in the Assign Your Columns, Run the Data Check card. If your columns follow a naming convention Skeleton Key recognizes (see the tip below), many roles arrive already mapped, so you confirm or adjust rather than start from scratch. The roles are:
- Date and KPI (your outcome). For the KPI you also pick its type: Revenue ($) or A count (orders, installs, etc.). For a count, a value field appears where you can put a dollar figure on one outcome, like an average order value. Fill it and returns come back in dollars; leave it blank and they come back as impact per dollar instead. Read your results shows what each choice looks like.
- Paid media (spend, plus an optional exposure metric). The spend column is required; you can attach one exposure metric (impressions, clicks, or GRPs) to describe how the spend showed up.
- Paid R&F media (reach, frequency, and spend) for channels where you have true reach and frequency data, like YouTube.
- Organic (a metric only, no spend), for unpaid drivers like email sends or organic social.
- Organic R&F (reach and frequency, no spend).
- Controls, for outside conditions that move your KPI but aren't yours to steer: holidays, weather, competitor activity.
- Treatments, for non-spend levers you pull yourself, like a price change or a promo flag.
- Geo & population, if your data covers more than one region (see below).
- Anything you don't map stays Unmapped and is left out of the model.
Two rules the mapper holds you to
One exposure metric per channel. A paid channel takes its spend plus at most one metric (impressions or clicks or GRPs, not several). Meridian models a channel through a single exposure axis, so the mapper only lets you attach one.
A channel is paid media or reach/frequency, never both. Once a column is part of a reach/frequency channel it leaves the paid-media tray. Pick the form that matches the data you actually have for that channel.
Start from a template to skip most of the mapping
Build your CSV on top of one of the templates, linked on the new-run page: National or Multi-geo. They follow a column-naming convention that Skeleton Key recognizes, so when your column names match it, most of the mapping is filled in for you automatically. The patterns that matter most:
- Spend:
channel_spend, for examplepaid_search_spend. - An exposure metric:
channel_impressions,channel_clicks, orchannel_grps. - Reach and frequency:
channel_rf_reach,channel_rf_frequency, andchannel_rf_spendtogether. - Organic:
organic_channel, plusorganic_channel_reachandorganic_channel_frequencyfor organic reach and frequency.
We recommend always naming a media column as the channel plus its metric (tv_spend, tv_impressions).
Columns that don't follow the convention still work. You just map those ones yourself.
Paid media
The spend column is the channel — what you map under Paid media is what the model divides by to compute ROI. You can optionally bind one execution or exposure metric (impressions, clicks, or GRPs) to a channel to describe how that spend showed up, but only one: Meridian models each channel through a single exposure axis, so the mapper caps you at one metric per channel.
Controls
A control is an outside condition you can't intervene on: a holiday, the weather, a competitor's activity. It corrects the model for outside noise so credit isn't wrongly assigned to, or taken from, your marketing. Smooth, recurring seasonality usually needs no column at all; the model's baseline absorbs it. A holiday flag or a weather series belongs here.
How to tell a control from a treatment: the question is not whether the column is a flag or a curve; it is whether the lever is yours. A control has no baseline you chose — you can't turn a holiday on or off.
Treatments
A treatment is something you decide and could have done differently, with a natural baseline to compare against: your price (baseline: the regular price), your promos (baseline: no promo). A price change or a promo flag belongs here. See Controls if you're unsure which side a column falls on.
On a multi-region file, treatment chips carry the same Scale by population switch, off by default. Turn it on only for totals that grow with region size, like a count of in-store events; leave it off for prices, discounts and promo flags.
Variables to leave out
Watch for mediators
A mediator is a variable that sits between your marketing and your KPI, on the path from one to the other. Site traffic is the classic case: ads drive traffic, and traffic drives sales. If you feed site traffic into the model, it absorbs the credit that belongs to the ads that caused it, and your channels look weaker than they are. Leave mediators unmapped. The mapper flags a column that looks like one with an amber warning, but you know your funnel better than it does, so check anything on the path between spend and outcome.
One exception is worth knowing. Search query volume looks like a mediator, and for most channels it is: TV and social make people search, so query volume takes some of their credit. But it also drives your paid-search results directly, since more searching means more auctions for your ads to win. Google's guidance for Meridian is to include query volume as a control when paid search is one of your channels, because it corrects a known bias that otherwise flatters paid-search returns. Map it under Controls, and expect your demand-driving channels to give up a little credit in exchange for a more honest paid-search number. If your paid search is split into brand and generic campaigns, map two controls, brand query volume and generic query volume, so each side is corrected by the searches it actually harvests. Both templates carry these as brand_query_volume and generic_query_volume.
The best source is Google Query Volume (GQV) from Google's MMM Data Platform: weekly, split into brand and generic, by region, and made for Meridian. Its values are an index, but Google uses the same index across every region in a country, so they still compare like counts and still take Scale by population below. Without access, two fallbacks exist, each with a catch. Google Trends is weekly, but each value is a share of all searches in that region and period, rescaled to 0 to 100 on every request, so pull the whole date range in one request and use it for a national model only. Google Ads Keyword Planner gives real search counts, but only by month and only for the past 4 years, so a weekly model would have to spread each month across its weeks.
On a multi-region file, turn on Scale by population on the control's chip (a check mark shows it is on) so searches are measured per person in each region, the same way Meridian measures sales and media; leave it off for flags, percentages and per-region indexes such as Google Trends. The template's organic_search column is SEO sessions, not query volume; it belongs under Organic.
Multi-region, reach and frequency, and organic
Three optional inputs make a model stronger when your data supports them: more regions, richer reach-and-frequency data on the channels that have it, and organic drivers.
- Multiple regions. Add a geo column and a population column (the region's population, repeated on every row of that region). Every region is another set of evidence, so a geo model usually gives tighter estimates than a national one on the same history. It isn't automatic: a long, well-controlled national series can beat a thin panel of a few regions, so judge the result by its health verdict, not by which type you ran. Population is required so the model can scale regions of different sizes against each other. With national totals only, leave geo unmapped and run national.
- Organic drivers. Unpaid drivers go in Organic (or Organic R&F) so their contribution shows up in the breakdown without being treated as paid spend. Because they carry no spend, organic channels get a contribution figure but no return on spend and no response curve.
Reach and frequency
Channels mapped as Paid R&F media (or Organic R&F for unpaid ones) let the model find an optimal frequency rather than treating every impression the same. Use this only for channels where you genuinely have reach and frequency figures, not derived or estimated ones.
A complete set is required: a paid R&F channel needs all three columns (reach, frequency, and spend); an organic R&F channel needs both reach and frequency, since it carries no spend. A partial set fails the data check.
The data check before you run
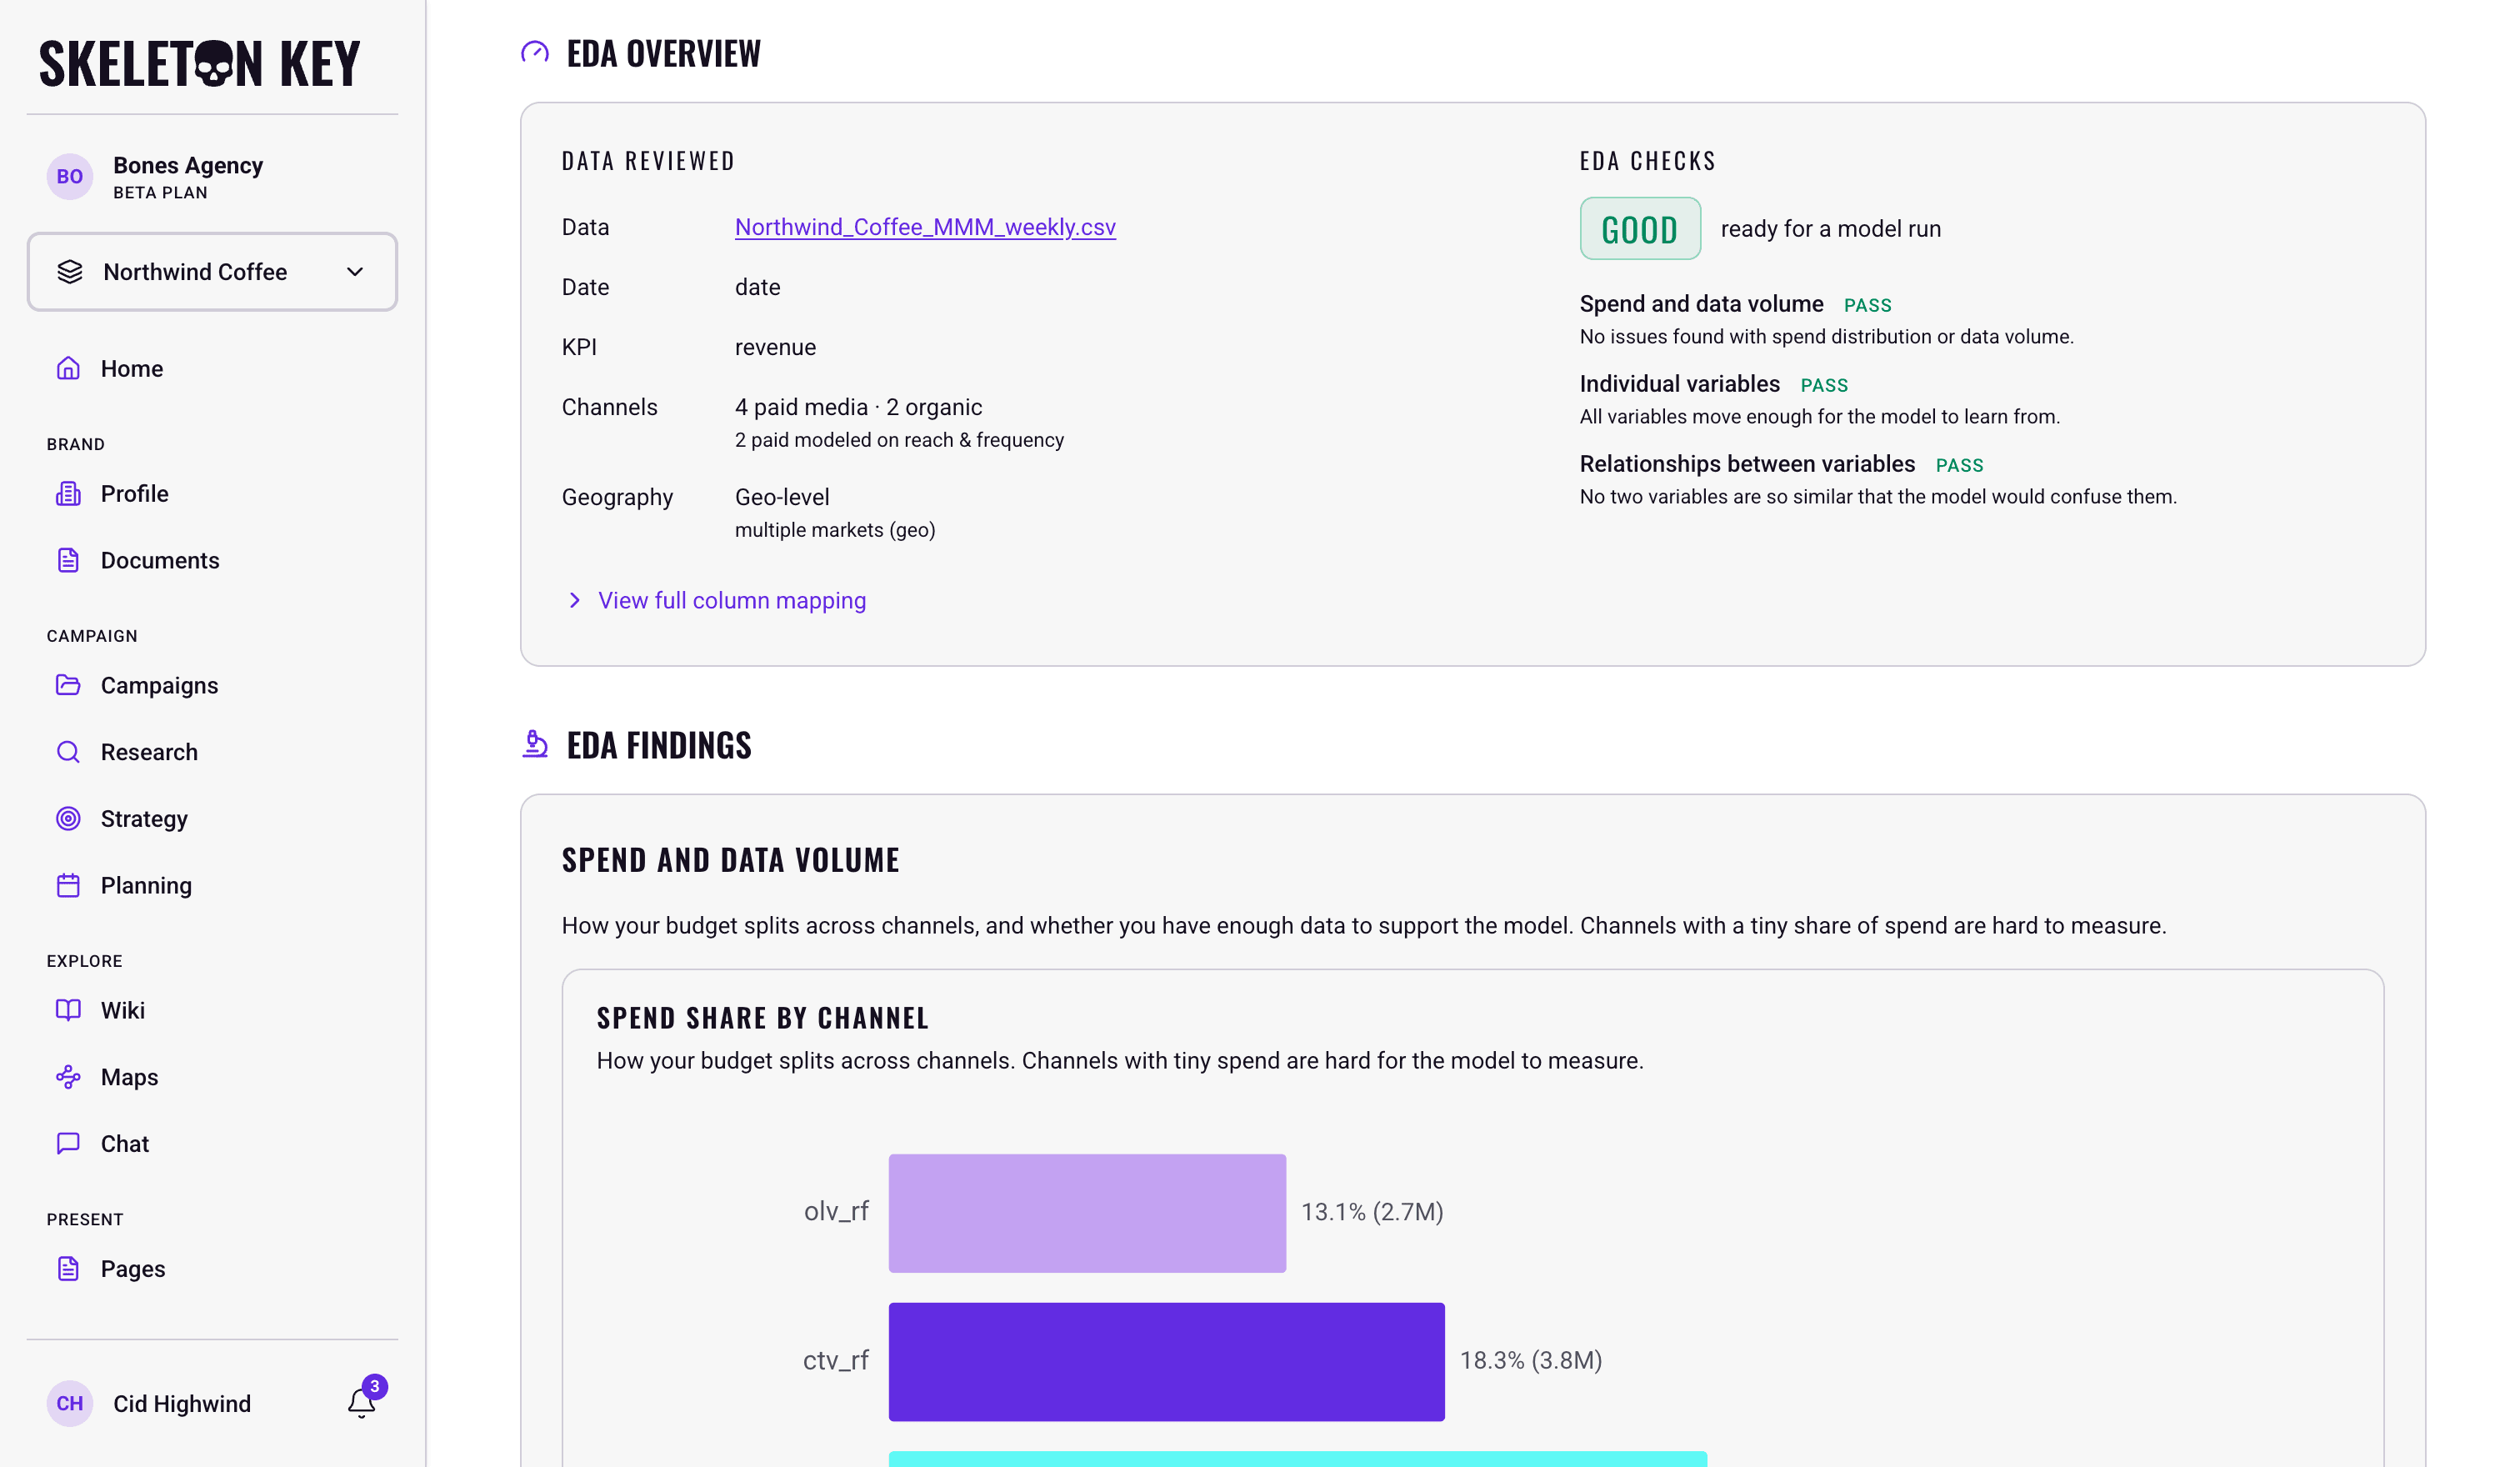
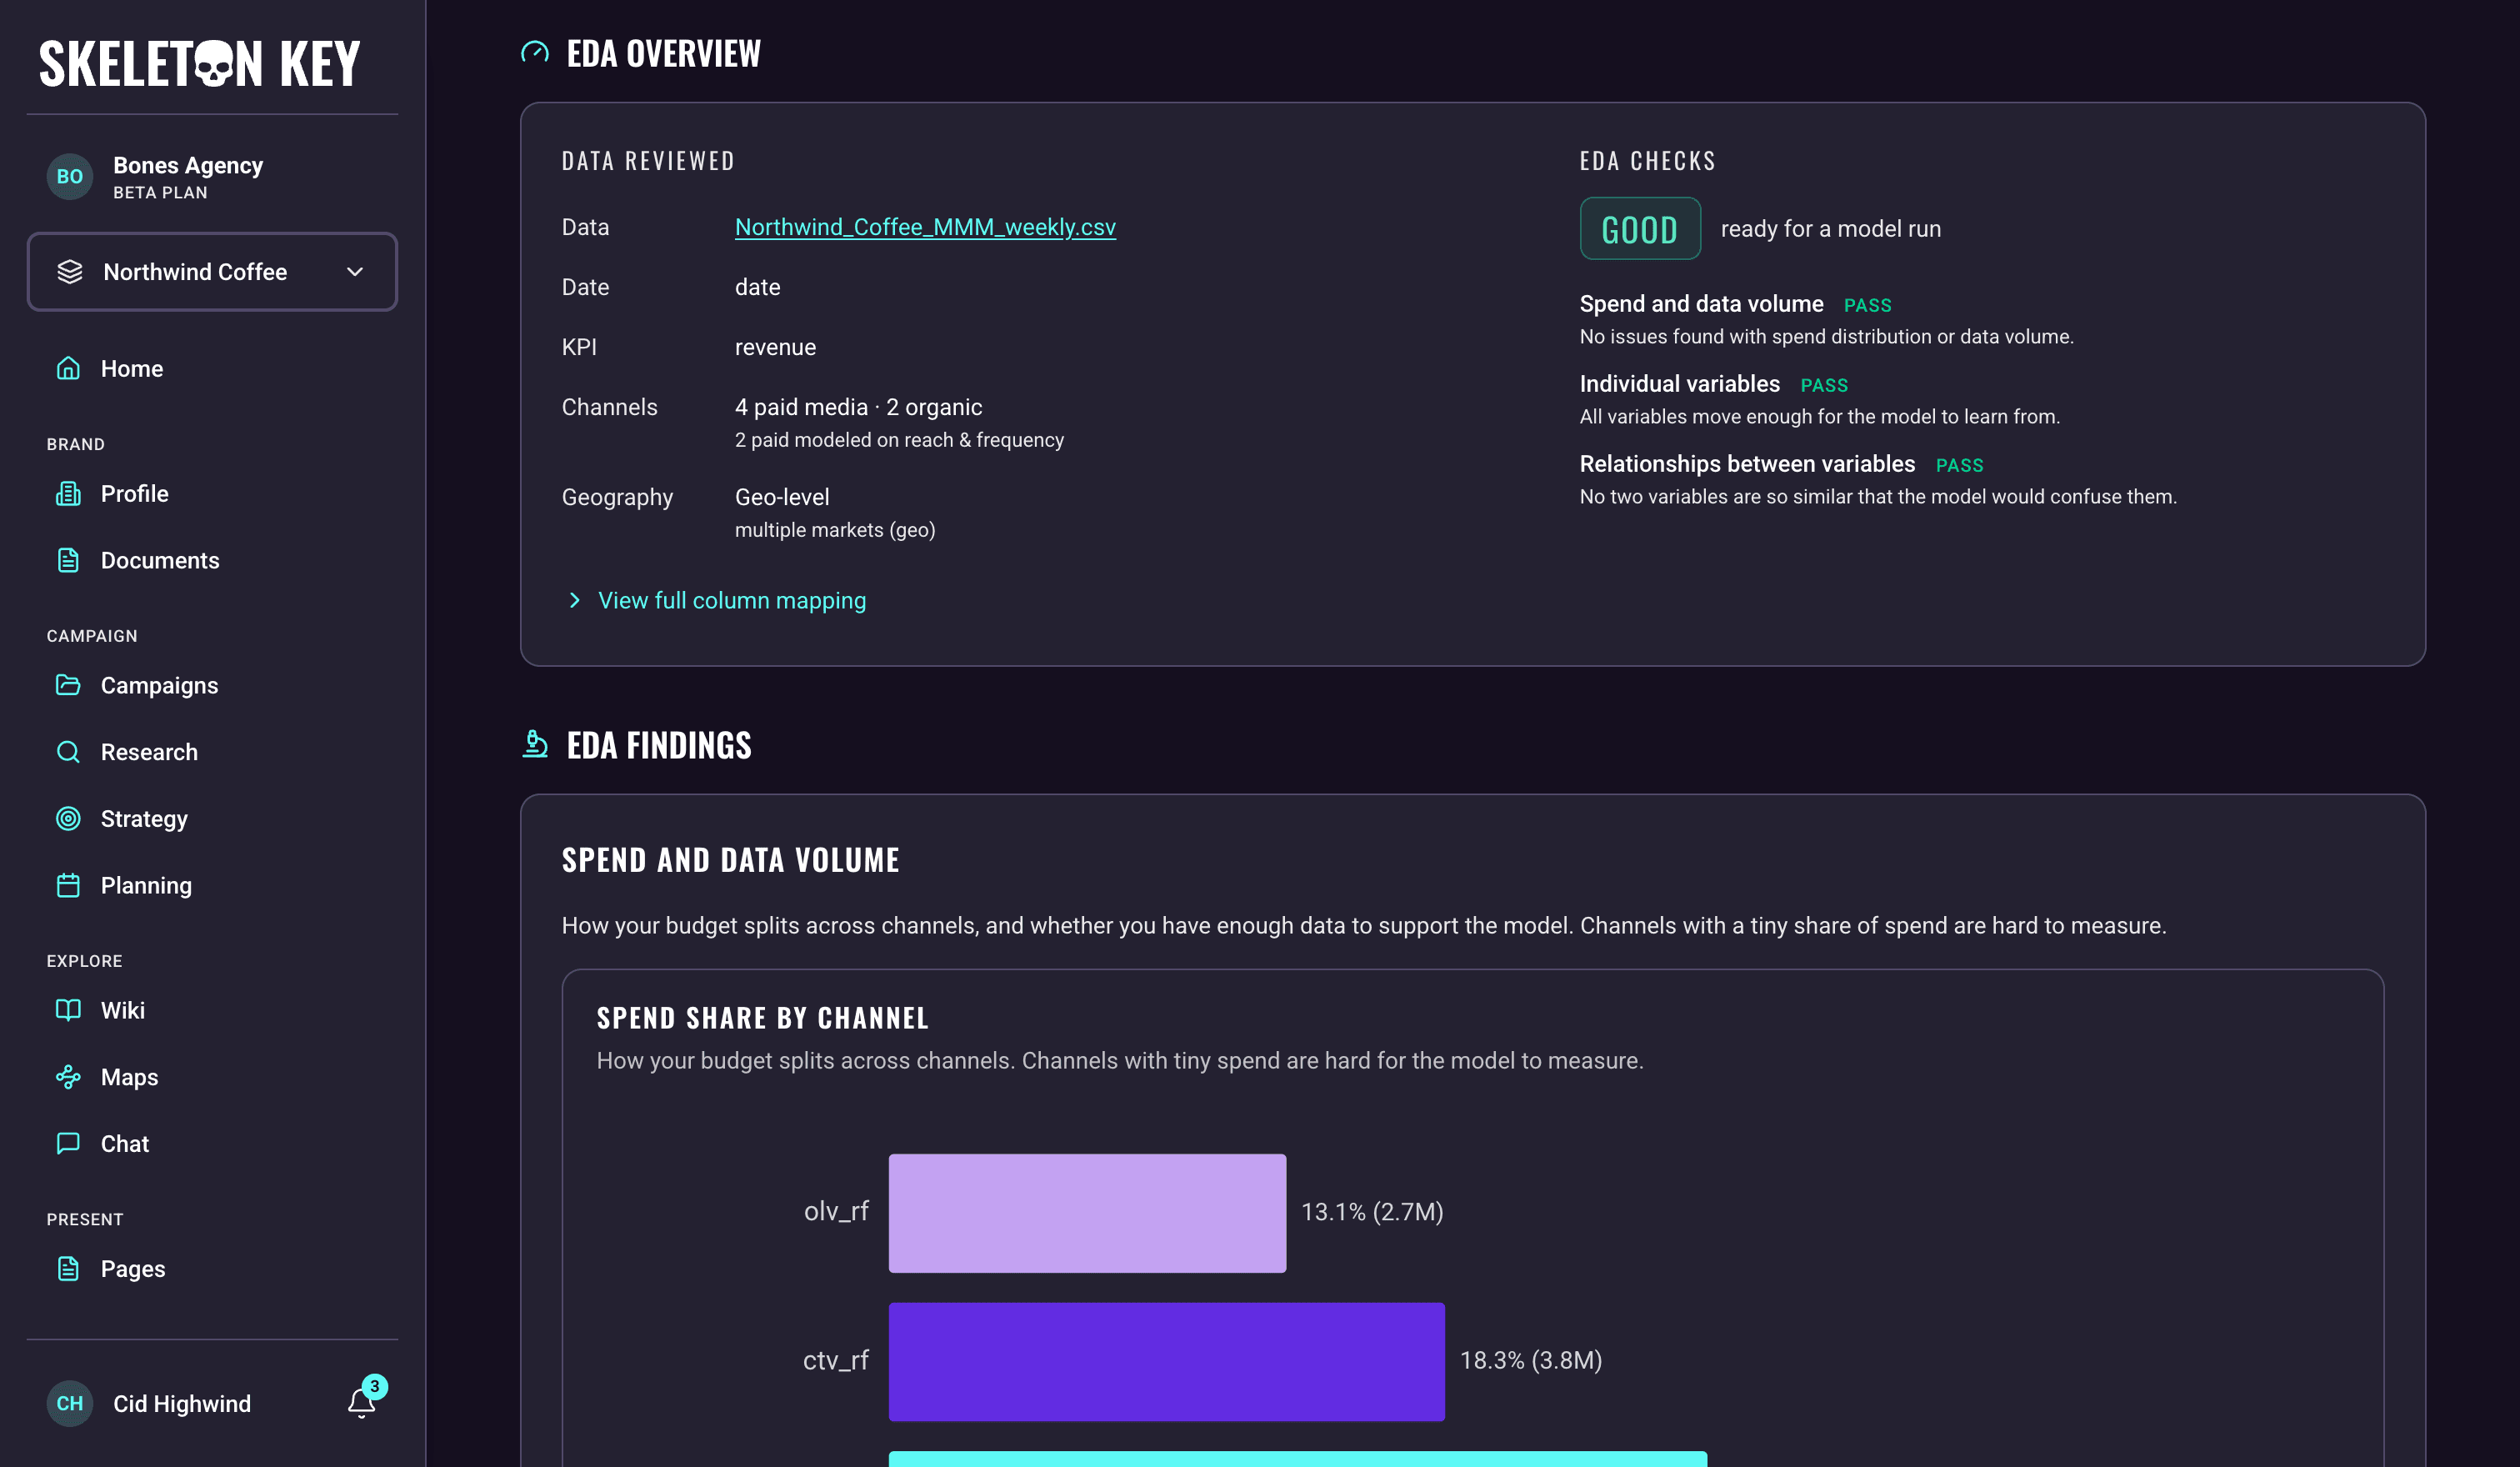
Before you fit a model, run the optional data check over your mapped data. The check itself usually takes three to six minutes. It returns one of three verdicts:
- Good — no statistical issues found, ready for a run.
- Caveats — some checks want a second look first; the data is usable with caveats.
- Issues — it flagged data problems worth fixing.
Behind that verdict, the check runs a battery grouped into a few sections:
- Spend and data volume — how your budget splits across channels and whether you have enough history for the model. This is where data points per parameter lives, the single most useful number: Meridian's rough guide is around 15, and if you're under it the page lists the levers in order of impact (add more history, combine or cut tiny channels, drop controls you can't defend, reduce knots). Channels with a tiny share of spend are shown here too, since they're hard to measure.
- Individual variables — whether each column moves enough for the model to learn from it (a near-constant column gives no signal), and which periods look like outliers, whether from a real event like a holiday or a genuine data error worth fixing at the source.
- Relationships between variables — how strongly your columns move together. Two that move in near lockstep are hard for any model to tell apart, so it would split the credit between them; the check flags the pair to combine or drop.
- Population scaling (multi-region runs only) — checks specific to geo models, where each region's population is used to weigh regions of different sizes against each other.
The data-check page also has a Download menu with three formats: a PDF of the report as you see it, a Markdown file of the findings, and the Technical report, Meridian's own EDA output as a standalone HTML file. The technical report carries detail the summary view leaves out, like the full list of flagged outlier periods.
What blocks and what warns
Two kinds of finding come out of the checks. Hard data errors (the rules above) block the run: the setup page shows what to fix and will not start a job that is guaranteed to fail. Statistical findings, like thin history, a near-constant column, or two channels moving in lockstep, warn but let you proceed after confirming, because they are judgment calls about quality rather than certain failures. A clean check means your data is sound, not that the eventual results are guaranteed reliable; that part you read from the model-health verdict after the run.
The analysis opens as its own report page. Once it looks reasonable, head back to the setup page and start the run. Reading what comes back is the next page.
Last updated: 2026-09-20